2024-07-1617:07 Status:IBnotes
Introduction
Our perceptions of chemistry are limited to fragrances, color change, and whatever measurements we can perform. Analytical chemistry allows us to measure things that we cannot see in order to visualize a molecule, composition and structure.
The purpose of analytical chemistry is to find:
- Elemental composition
- How atoms are arranged/bonded (aliphatic, aromatic, or other functional groups.
Spectroscopy
Spectroscopy is a branch of science concerned with the investigation and measurement of spectra produced when matter interacts with the electromagnetic spectrum. A wave can be defined using the following: Where is the speed of light, , =frequency (), and is the wavelength A particle’s energy can be defined using the following: Where = Energy of the particle, is Planck’s constant, and is the frequency. Substituting the speed of light’s frequency equation into the energy equation a new formula for the energy of a particle.
Recall that atoms exist in several energy levels, however, they prefer to stay in a quantized energy level. These come about is bonds in molecules, stretch bend rotate or as energy from one orbital to another.
As with energy states of atoms, the energy state of molecules can be quantized - they only exist at discrete amounts.
Process
- Expose the sample with EMR (Electromagnetic radiation)
- The sample will absorb specific energies and reflect others.
- The detector will pick up the reflected energy and also determine what was absorbed.
Frequencies of light
- Microwave: Absorbed by nuclei, increases the rotational energy of polar molecules
- Infrared: Absorbed by the bonds, which causes them to stretch
- Visible/UV: Can reveal electron transitions (flame tests)
- X-rays: Can reveal interatomic distances.
Percent composition:
Tells you by mass what percent of each element is present in a compound. The steps for calculating:
- Find the molar mass of the elements
- Find the mmolarmass of the compound
- Divide the components by the total
Example 1
What is the percent composition of phosphorous and chlorine in ?
Example 2
Propose a reasonable molecular formula given the following percent composition. \ \ \ \ \ H=\frac {11.18\%}{1.01g}=11.1 \ \ \ \ \ \
| C | H | X | |
|---|---|---|---|
| 1 | 2 | ||
| 12.01 | 2.02 | 4.00g | 18.02g |
| 66.63% | 11.18% | 22.19% | 100% |
Increasing the number of carbons e.g. fits the ratio: and … fits the ratio: .
Index of Hydrogen Deficiency (IHD)
The IHD is the count of how many molecules of can be added to the structure to make it saturated. The IHD number tells us how many double, triple bonds, or cyclic rings are present:
Where each carbon determines the maximum amount of hydrogen, . Take away the hydrogens already present. Oxygen forms two bonds and has no impact on hydrogen count. Nitrogen forms three bonds, therefore added hydrogen. Halogens, replaces hydrogen 0.5 is used to account for the nature of hydrogen.
Mass Spectroscopy
Mass spectroscopy is a physical analytical technique, and does not use EMR. This results in a stereograph, an image that compares the abundance percentage to mass. Molecules are converted to ions and then sorted by their mass to charge ratio: (m/Z).
This is done by introducing a small amount of the compound into a vacuum chamber, where it is vaporized and the sample is bombarded with high energy electrons.
\begin{gather} M+e^-\to M^++2e^- \\CH_3OH_{(g)} e^-_{beam} \to CH_3OH^+_{(g)} + offshot \ e^- \end{gather}
The molecular ions are then accelerated by an electric field and they form a beam of powerful charged particles that move into a powerful magnetic field. The ions are deflected by the magnetic field based on their charge and their mass (heavier compounds deflect the lens).
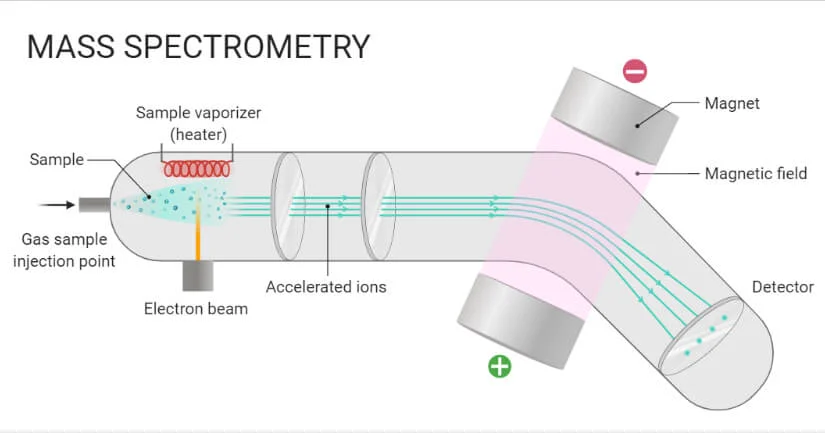
In the mass spectrometer produces a graph that plots the relative abundance of particles as a function of mass-to-charge ration (the scales vary).
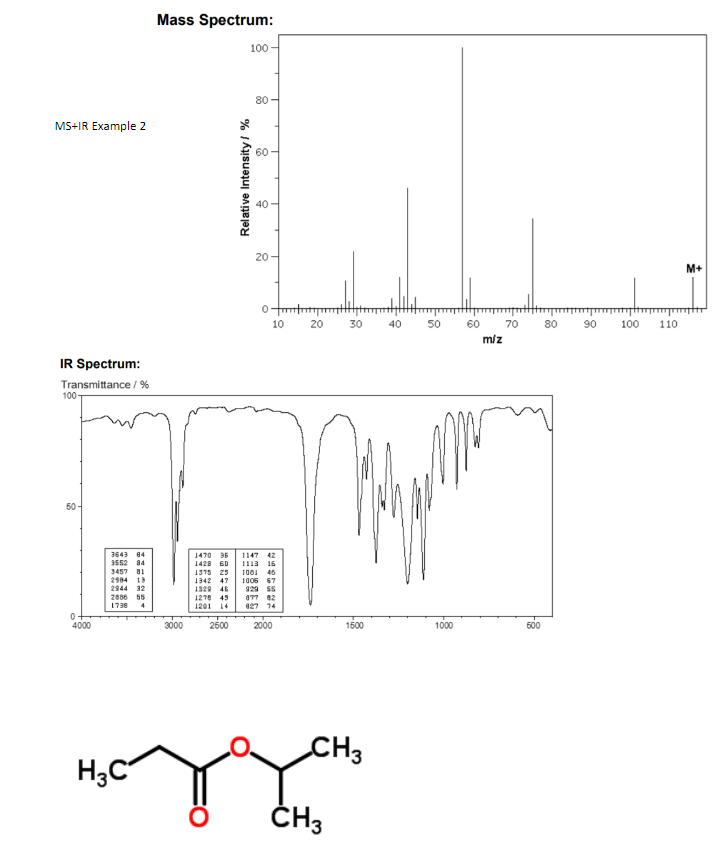
Example 2:

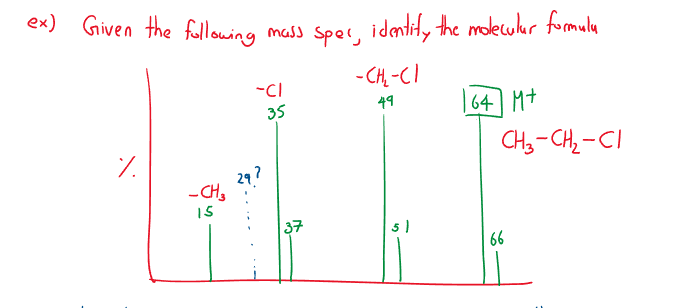
When a molecule is bombarded with electrons, it forms the parent molecule (the highest mass and significant peak), often denoted .
Continued bombardment creates fragments called daughter molecules (not all fragments are possible to theoretically show up on the spectrometer)
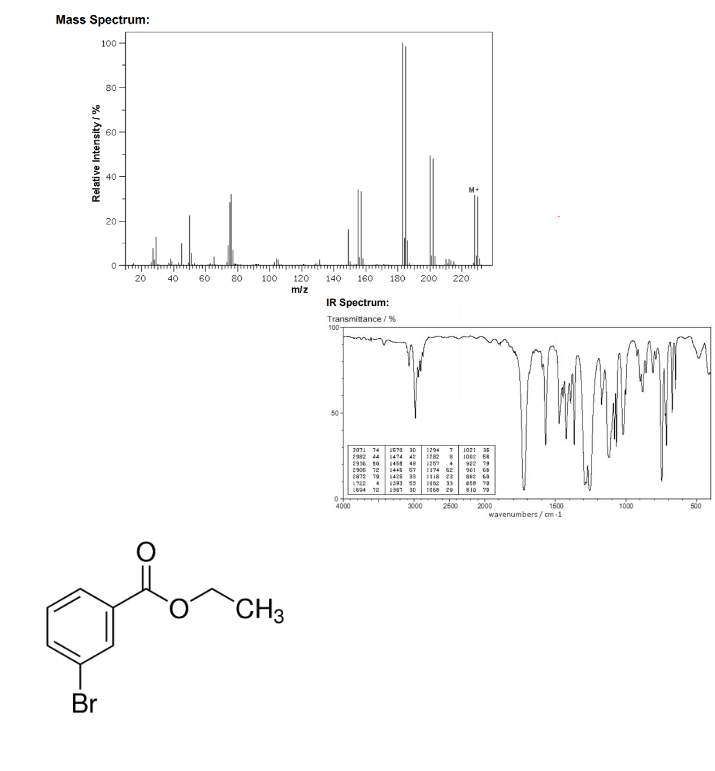
Distinct isotope patterns worth noting:
Chlorine, is 3 times as large as . Bromine, is as large as .
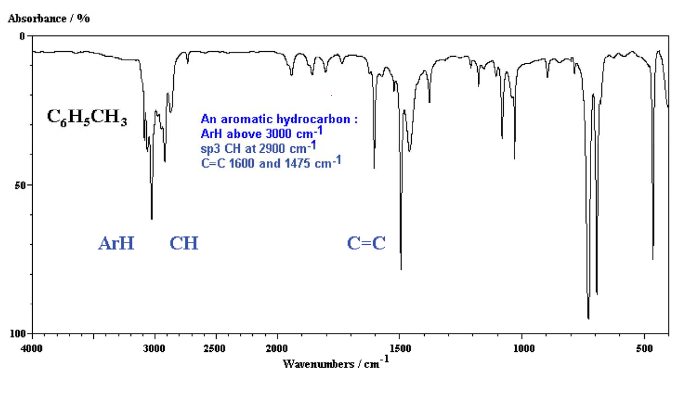
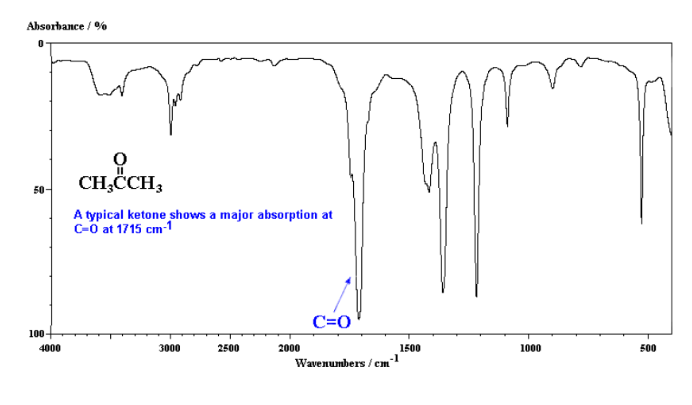
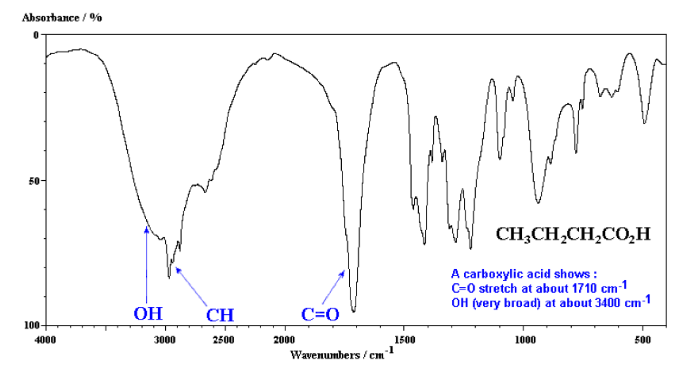
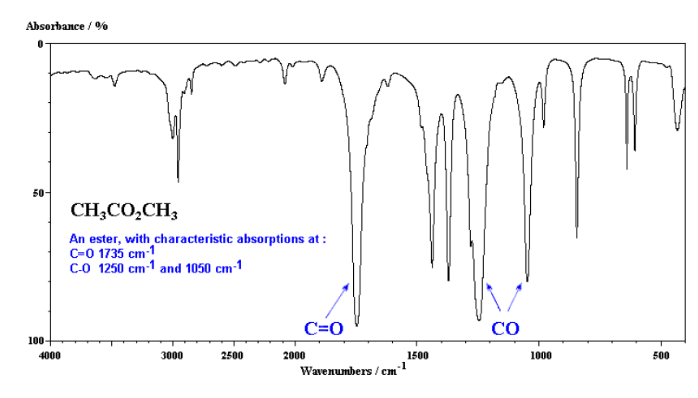
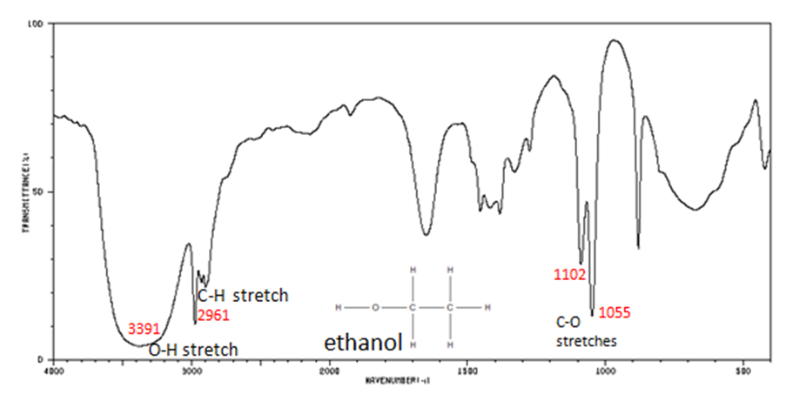
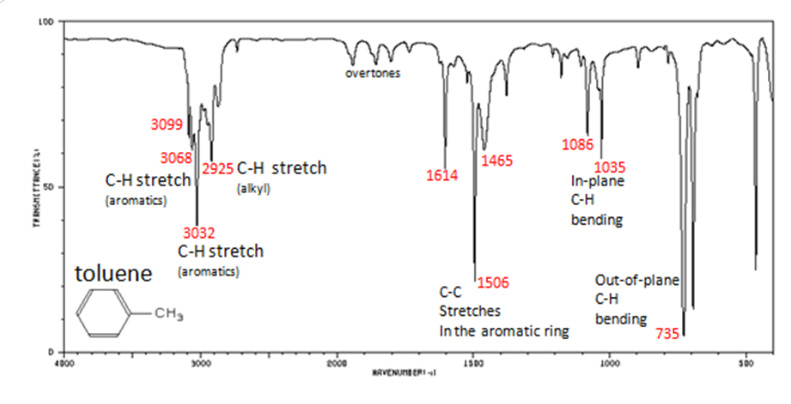
Infrared Spectroscopy (IR Spec)
IR Spec is notoriously unreliable IR is used to determine the types of bonds (works best for polar bonds) in a compound. Passing IR radiation () through a sample. IR radiation causes excitation of covalent bonds for ‘stretching and bending’ of bonds. Percent (%) transmittance is the amount of radiation that passes through the sample and is detected (a 100% transmittance would indicated that the molecule did not absorb any IR). A wavenumber is the number of waves/centimeter = . Machines operate in the range. Each is fired at the molecule one at time.
Nuclear Magnetic Resonance Spectroscopy (NMR Spec)
Electrodynamics NMR spectroscopy is predominantly used for detecting bonds. It only works when there is an odd number of protons or an odd number of neutrons. ( works but does not). Because carbon-12 does not have odd neutrons or protons, it does not have spin. For organic chemistry, is used as it has an odd number of protons, spin, and creates its own magnetic field.
NMR is the most useful technique for detecting organic structures. Nuclei are made of charged particles, and nuclei of isotopes with an odd mass number have a spin. Nuclei have magnetic fields that can be manipulated: in solution these nuclei are in random positions, but they can be manipulated in a magnetic field to be uniform and aligned with each other.
In a magnetic field, protons will all oppose each other ( spin state) or face the same direction ( spin state). The spin state has a lower energy state than that of the spin state. The majority of the protons will be in the spin state as it is the lowest, most stable state.
.png)
*With the increase of magnitude to the applied magnetic field, , the difference in energy between the and states, , increases proportionally.
Where is Planck’s constant, is the gyromagnetic ratio, and is the applied magnetic field. When there is a jump to the state from the state, a radiofrequency, is emitted.
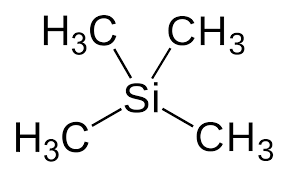
Tetramethylsilane (TMS),
This is added to the H-NMR and serves as a standard reference. All the hydrogen are the same and provide one signal that is easy to locate. TMS is inert and has a low boiling point (it can be separated from the sample).
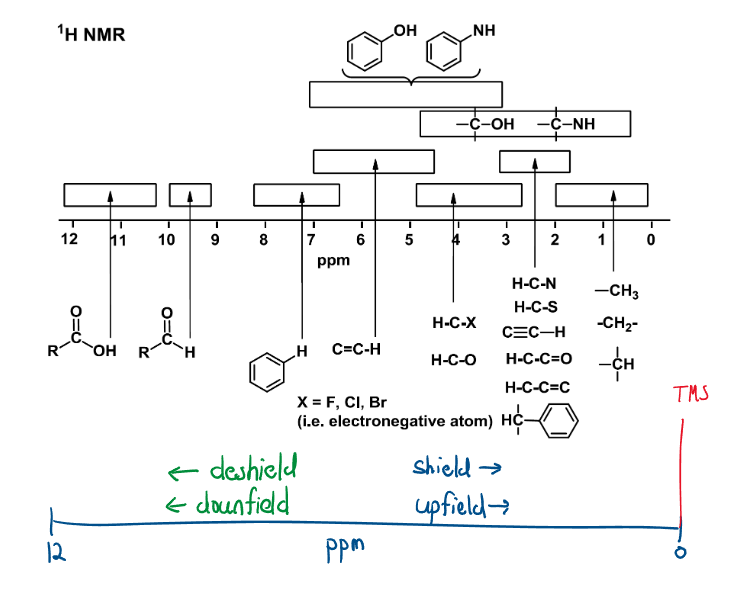
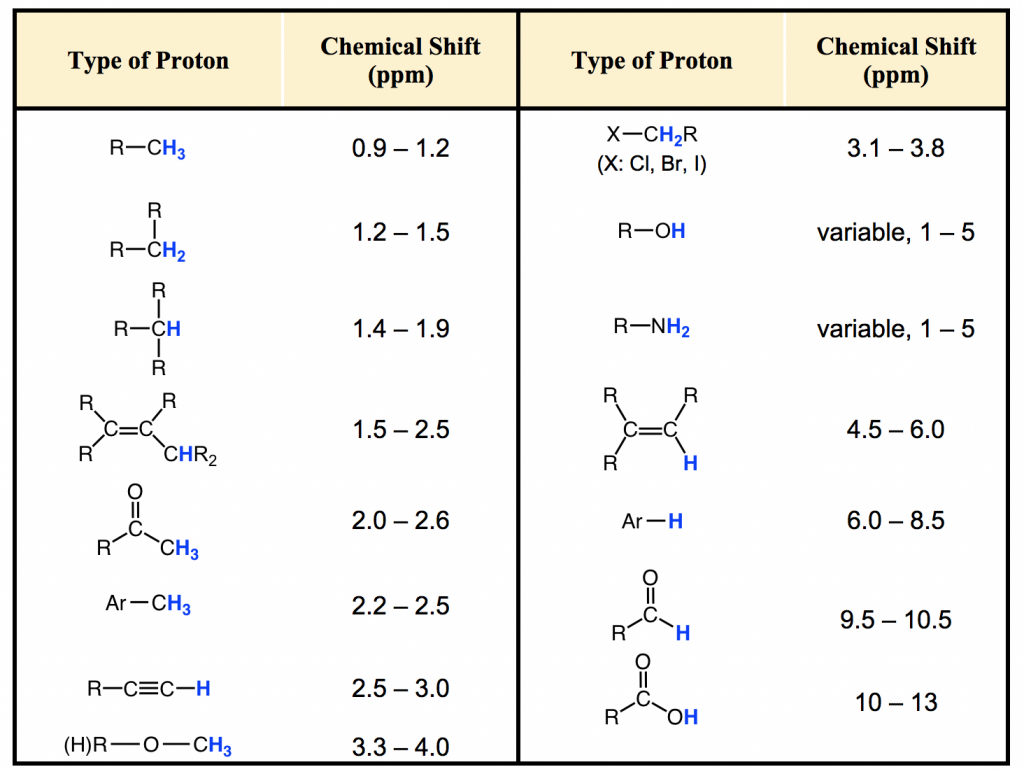
NMR (Table 27)
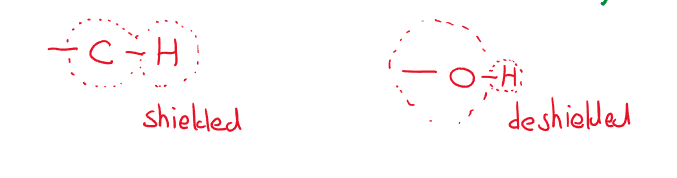
Each “type” of hydrogen bonding shows a different signal. This depends on the desheilding (downfield)/shielding (upfielding) nature of the bond. Shielding occurs when there are more electrons present around the nucleus of the . Electrons withdrawing groups, (like an alkene or an atom) cause downfield shifts as the deshifted the . This can be thought of as how “crowded the atom is.
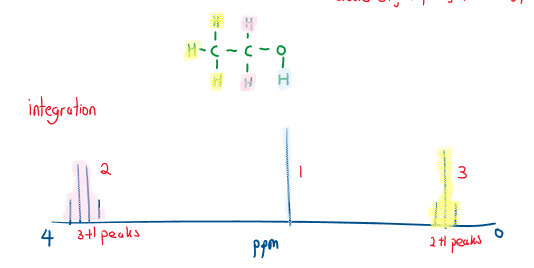
Interpreting ^1H \ NMR
- Peak area (integration trace) Peak area is proportional to the number of creating the peak (a higher peak means more atoms of that environment):
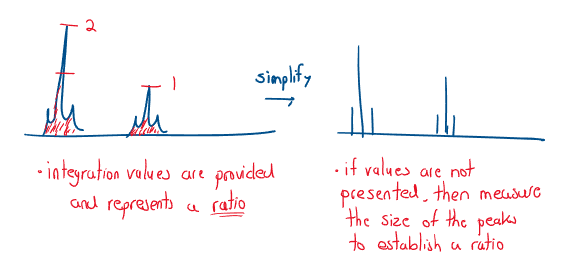
- Spin-spin splitting Each ^1H is essentially a tiny magnet, therefore each H feels a magnetic field from its neighbors. If H has a nucleus, n, neighbors that have significantly different chemical shifts, the signal splits into n+1 peaks: A single peak = a singlet, two peaks = a doublet, triplet, quartet etc.
 Sometimes the peaks are too tiny/overlap and splitting is not possible to determine.
X-Ray Crystallography
X-Ray crystallography is an analytical technique commonly used in structural biology and in organic chemistry to determine the 3D structure of small molecules (e.g. proteins).
- Crystal formation
- Mass produce protein, exact and purify.
- Crystallize by dehydrating (creates an orderly structure).
- X-Ray exposure
- Smaller crystals require stronger X-Rays.
- The crystal diffracts the X-Ray in a pattern that is specific to the crystal.
- Analysis
- “Magical math”
- The pattern helps us solve for the 3D structure
- Use a computer to model molecules using complex equations and algorithms
The advantages of doing so are that detailed 3D structures are produced, however it is limited in that larger proteins are really hard to crystallize and therefore can only produce very small crystals. Therefore, more powerful X-Rays are needed to model these proteins.